HDB Dashboard
projects | | Links: Dashboard link

data analysis data visualisation
🚩 Goal
Buying (or at least, trying to buy) a flat built by the Housing Development Board (HDB) is a common headache faced by many Singaporeans.
As choosing a HDB flat is a major financial decision for many, it is crucical to understand the trends and factors that influence HDB valuations to make as informed of a choice as possible.
This dashboard aims to serve as a comprehensive and intuitive tool to explore and analyse:
- Trends in HDB prices and # of transactions from 2009 - 2019
- Factors that significantly affect HDB prices
📊 Data
Data for resale transactions from 2009 - 2019 was retrieved from data.gov.sg, a public API repository of datasets related to Singapore.
Each row represents a unique transaction and includes details such as the transaction_date (representing the year and month when the transaction took place), flat_type (the type and size of the flat sold), town (district where the flat is situated), and resale_price (the price at which the flat was sold).
For a more comprehensive understanding of the dataset and to access the download link, please refer to this link.
🖥️ Dashboard
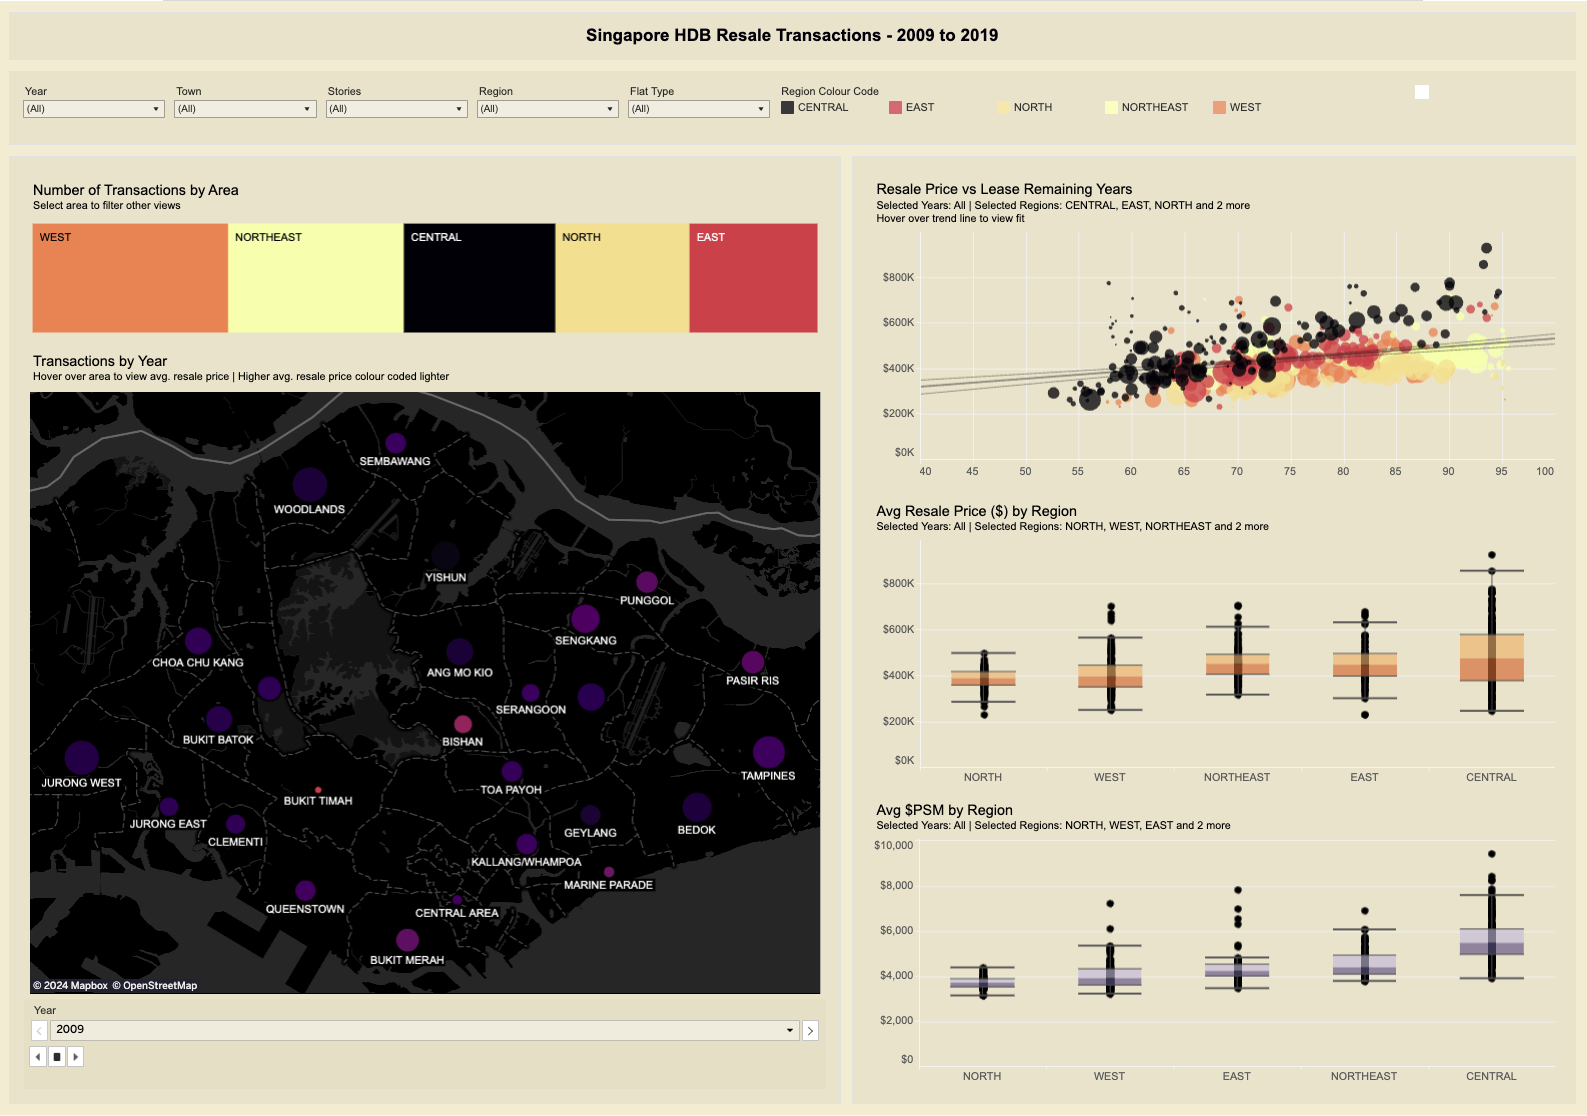
🔥 Features
This dashboard is split into 2 main sections
- The left section focuses on the number of transactions over time
- The right section focuses on the resale price of the flats
Global filters on flat types, year, and location
To better understand trends in prices for different areas and flat types, users are able to use the filter options at the top section to select a subset of data.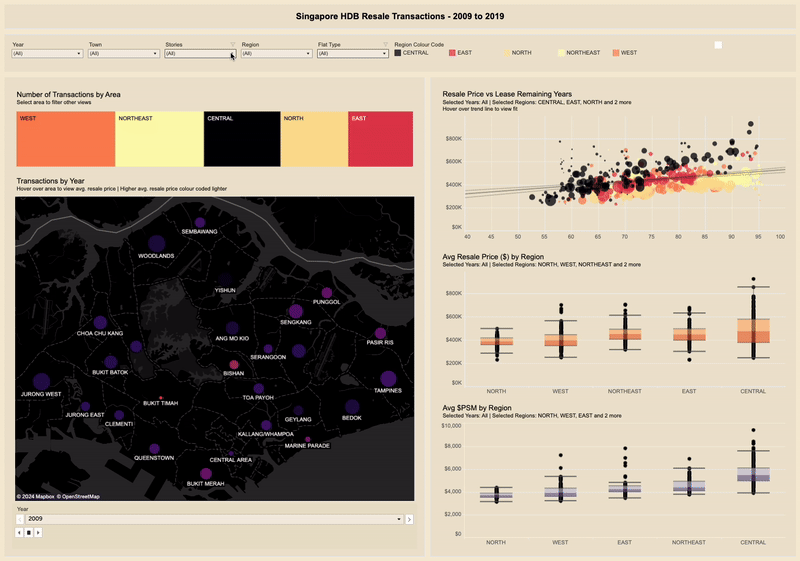
Visualising transactions by district over years
The geographical map showing the breakdown of prices by district features an animation which allows the user to loop through and view changes in metrics over time.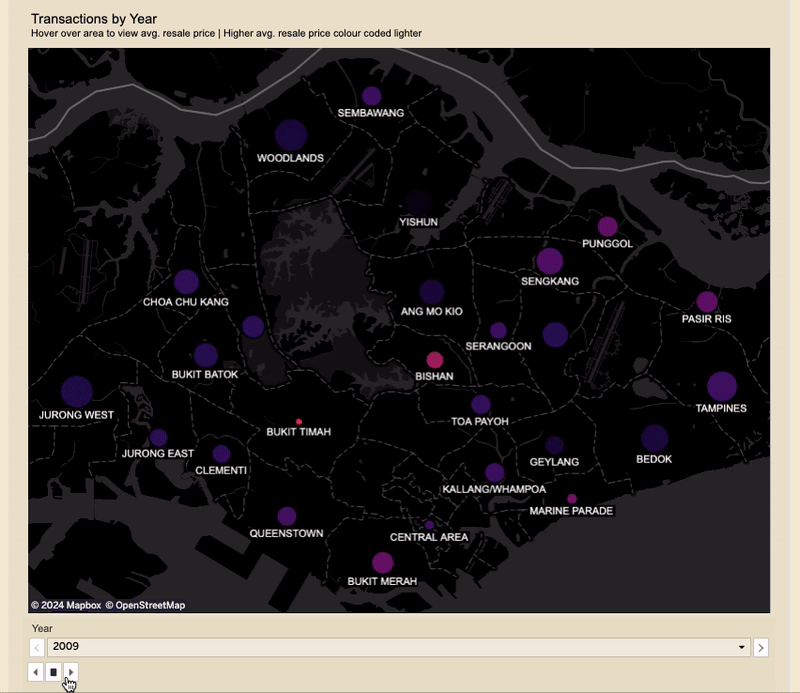
Interactivity
In addition to presenting 5 number summaries in the boxplots in the right region, users are also able to interact with the charts to either filter down the data, or to view individual transactions.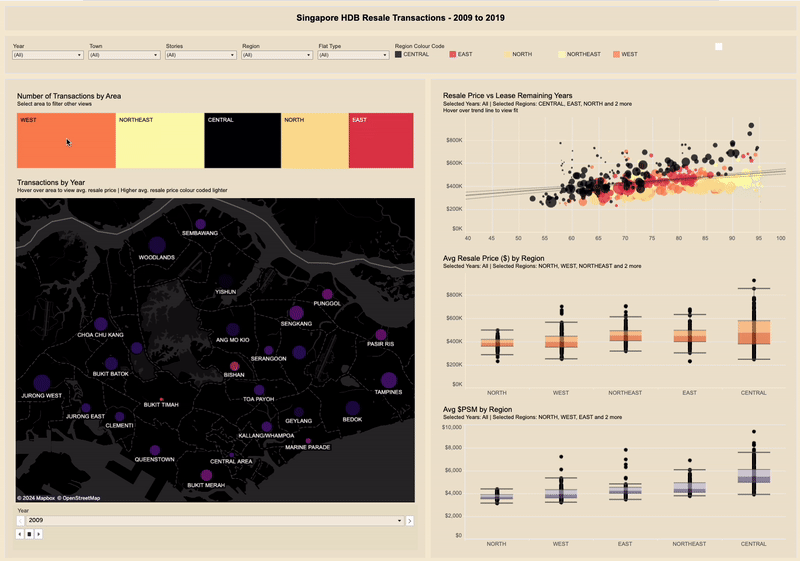
Play around with the dashboard here
Further Reading
[1] A brief history about the HDB scheme can be found here