Graduate Employment Survey Dashboard
projects | | Links: Dashboard link

data analysis data visualisation
🚩 Goal
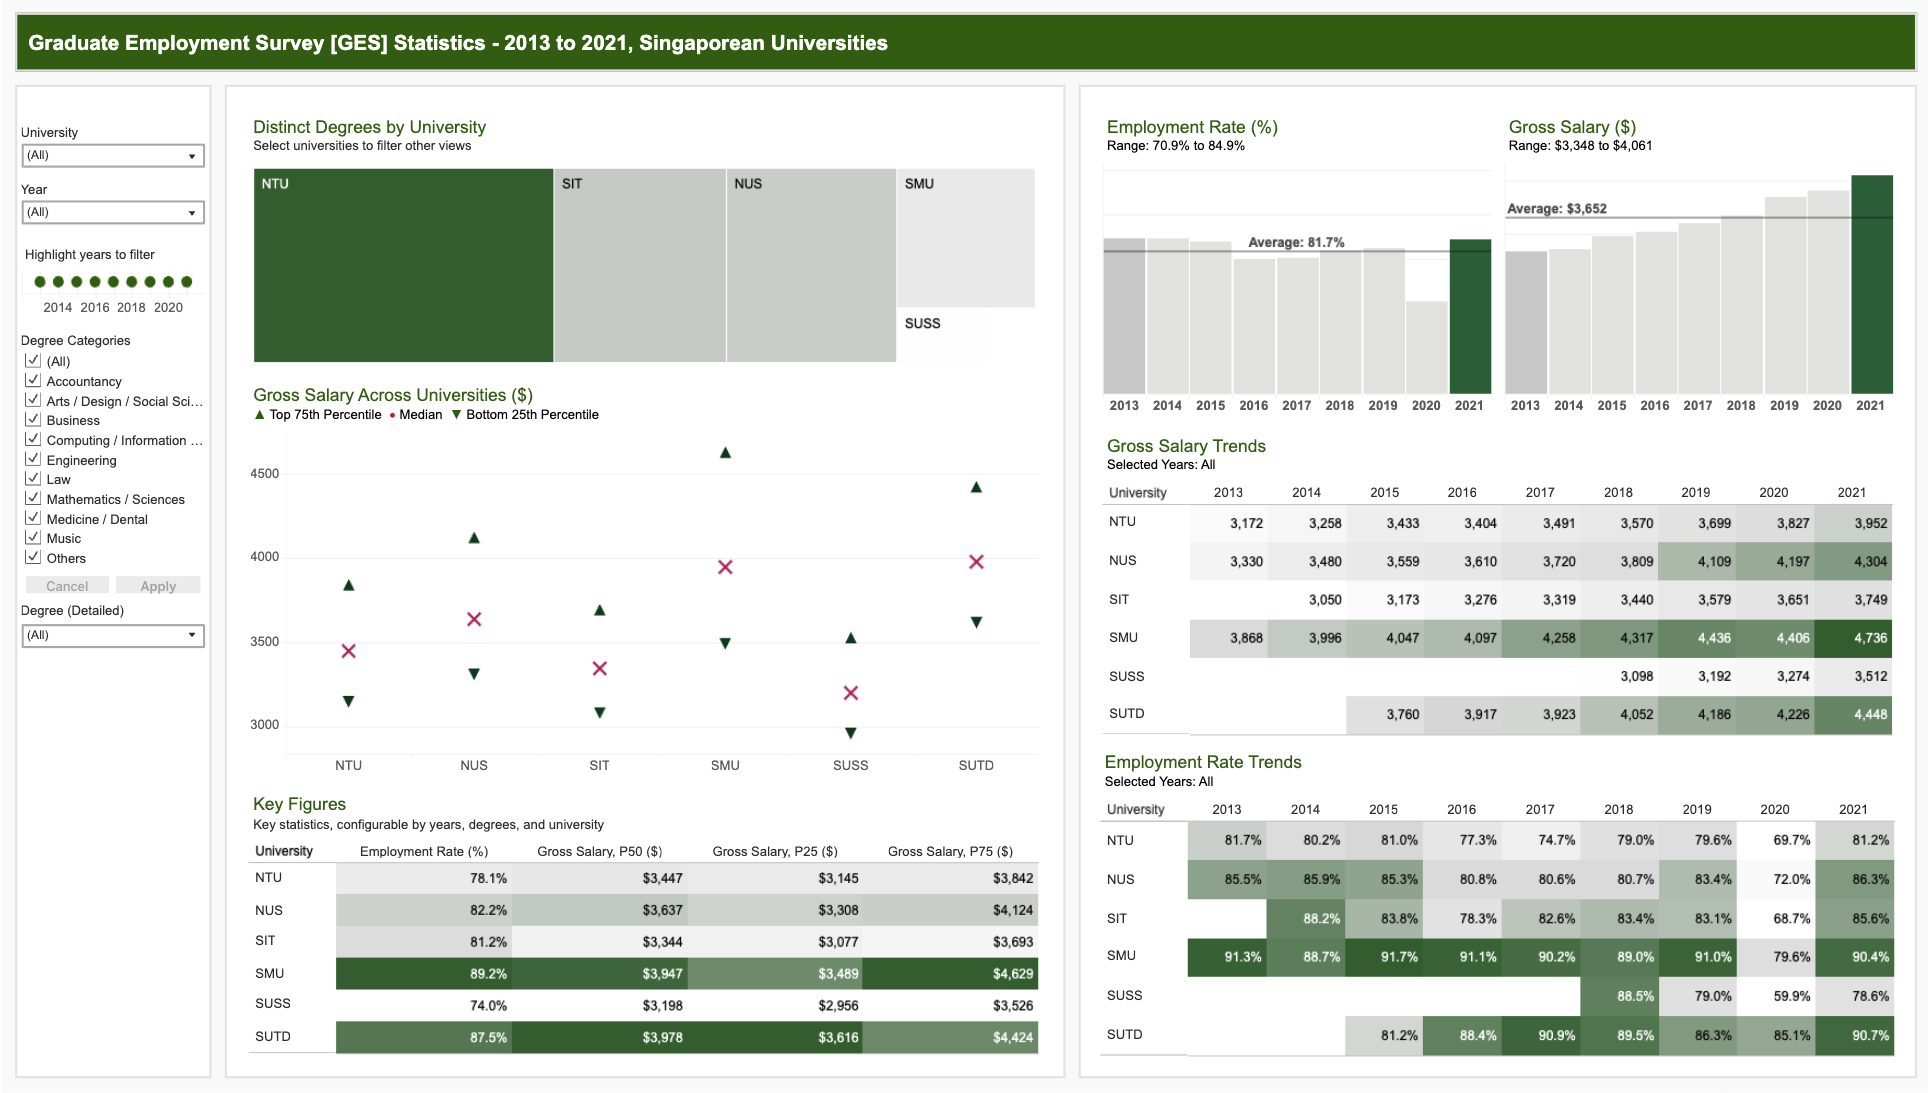
The Graduate Employment Survey is a yearly initiative by Singapore’s 6 autonomous universities to assess employment outcomes from their graduating cohorts.
This dashboard aims to utilise the responses collected from the Graduate Employment Survey to understand:
- How overall employment rates vary across universities, degrees, and years
- Trends in salaries by universities, degrees, and years
📊 Data
Data from the Graduate Employment Survey from the years 2013 - 2021 was retrieved from data.gov.sg, a public API repository of datasets related to Singapore.
The survey is jointly conducted by NTU, NUS, SMU, SIT (from 2014), SUTD (from 2015) and SUSS (from 2018) annually to survey the employment conditions of graduates about six months after their final examinations. As a result, data points for SUTD and SUSS will not be available in the initial years.
More information about the dataset and the download link can be accessed here
🖥️ Dashboard
🔥 Features
This dashboard aims to provide the user with a holistic view of key salary and employment trends
The views on the left half show the 75th, 50th and 25th percentile of gross salaries by university.
Dynamic charts
To better understand the employability trends of different degrees, users are able to use the filter options on the left section of the dashboard to select a subset of the data.
Yearly trends to identify changes over time
Salary and employment rate percentages are colour coded by value so that the user is able to quickly identify the universities and degrees with the largest changes in these key metrics over the years.
Play around with the dashboard here
Further Reading
[1] More information about the 6 autonomous universities can be found here